Being measurement-driven enables an organization to:
Plan, set priorities, and properly resource those priorities.
Manage execution and maximize impact.
Learn about what works (and for whom) and what does not to best deploy scarce resources.
Demonstrate impact to: (a) attract partners, allies, and funders, and (b) shift mindsets and ultimately the actions of others, including in policy.
Create a social contract that aligns internal teams and an organization with its external stakeholders. Clarity about what data to measure (and what targets of performance to achieve) also creates emotional safety for teams – what constitutes success is not a surprise.
Measurement-driven decision-making is also hard
People disagree about data. There can be strong disagreement about what to measure, and equally strong disagreement about how to measure it. Capturing data is also not costless: it consumes dollars, time, talent, and political capital, and for some program models, taking credit for outcomes is genuinely difficult.
Data also has consequences. Data is rational; systems are political. Measuring and reporting data wins friends and makes enemies. It is an act of accountability, which makes it high-stakes.
Data is also a source of power. As Laura Esquivel, the Mexican author and political leader, once observed, “Whoever controls information, whoever controls meaning, acquires power.”
In social initiatives, we measure what we value, so measurement reflects our values. Yet we seldom start by asking all stakeholders, and communities in particular, “What would you value?” and then build measurement out from that stakeholder-centric foundation. Every community, and even every individual, has its own definition of success and of how success is measured. In education reform, when we don’t understand a community’s definition of success and how it is measured, we run a real risk of imposing our own definition and our own measures instead. This risk is not abstract. Systemically marginalized communities have long histories of being denied measurement and data, which denies them power. Those same communities have also experienced data being weaponized against them.
Last, measures are ultimately not numbers but people. At the core of measurement are individuals who want the opportunity to realize their best destinies, and their families and communities who hope that that opportunity is available but fear it will be denied.
One challenge many organizations face in becoming more measurement-driven is a lack of common language
Without a common language, people can’t communicate or collaborate. (Side note: I suspect the people to blame for the proliferation of so much jargon are consultants.)
Words matter and have consequences. For example, during the planning for the Normandy Invasion in World War II, British and American officers almost got into a physical altercation because “to table” something in American English means to put it aside; in British English, it means to lay it out for discussion. They were talking past each other and miscommunicating during critical strategic planning.
Words can also be a source of inclusion or exclusion. Social ventures have their own jargon, and making sure everyone can speak it enables everyone to be heard.
Intended Impact
Theory of Action
Theory of Change
Ultimate Vision
Logic Models
Strategic Hypothesis
Measures
Metrics
Indicators
Data
Inputs
Programs / Activities
Outputs
Outcomes
Goals
Targets
Growth
Scale
Initiatives
Priorities
Objectives
Tactics
Imperatives
Big Rocks (& Little Rocks)
Deliverables
Dashboards
Milestones
Scorecards
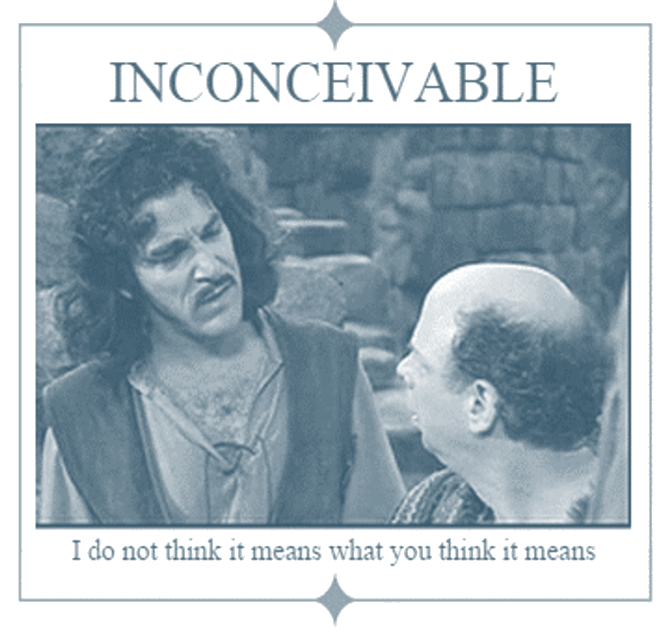
Source: The Princess Bride, 1987
Being measurement-driven requires organizations to be strong in all four parts of this cycle:
1
2
3
4
The “What” of Data
The “So What” of Insights
The “Now What” of Decisions
The “What Happens” in Action
Culture that prioritizes being measurement-driven and transparent
1Data, Targets, Dashboards
Right data, with agreement on a method for collecting it.
Right format for ease of understanding and for running sensitivities/scenarios.
Right timing and frequency.
2Insights
Right team comes together to analyze data.
Find connections across and within data to identify the “root cause” (or a strong hypothesis to test) of performance.
4Work Planning
Convert decisions into a plan of action.
Create conditions and expectations to ensure successful execution and follow-through of that plan.
3Decision-making
Clear process for making decisions.
Develop a set of options.
Decide which option(s) to act on.
Communicate decisions.
Many cycles and tools exist for using measures. I think this one is superior to many others because it is explicitly about making decisions. Any data collected should be examined through the lens of how it contributes to a decision, and if it doesn’t, it is probably a distraction. This data cycle originated in the Korean War. A U.S. colonel named John Boyd was tasked with determining why allied planes outperformed communist planes in dogfights. He discovered that opponent planes could accelerate faster, climb more steeply, and turn more sharply than allied planes – which sounded like potent advantages. However, allied planes were superior in two ways. First, pilots literally sat higher in the cockpit, so they had a better field of vision of the battle. Second, they had better controls that allowed them to translate insights into decisions and actions faster. This became known as the Boyd Cycle, or the OODA Loop, for Observe, Orient, Decide, and Act. Sometime in 2006, an education leader in North Carolina taught me the What, So What, Now What, and What Happens.
B. Measures to Measure
There are three critical types of measures (or data) that organizations need to be able to access and use together in this cycle:
Creating the most social impact from the use of limited resources
Beneficiary performanceOutcomes by program that an organization holds itself accountable for achieving
Financial performanceCosts and net financial contribution by program
Operational performanceIntended program design and actual program utilization by beneficiaries*
What is the cost per outcome?
Where are the trade-offs in ROI?
Is performance sustainable?
What is the most efficient and effective use of resources to achieve outcomes?
Where are there capacity constraints?
What is the true cost of providing actual programs?
What program elements are the biggest cost drivers?
Please view on a computer to be able to read it clearly
* Can also include staff performance, satisfaction, retention, etc.
The value of putting these three types of data together
Internal planning and management: Together, these measures enable an organization to: understand what is creating value (and for whom); understand the true resource requirements to achieve that value; identify where there are opportunities to test program variations; and see where options exist to make trade-offs between growth in scale, success, and sustainability.
External engagement and growth: Together, these measures enable an organization to right-size fundraising and pricing; articulate expectations to partners in proposals and negotiations; communicate its results and what is driving those results to beneficiaries, funders, and other stakeholders; and raise awareness, shift mindsets, and build support about what works and should be supported through policy and funding.
Defining four more measures to employ
Organizations benefit from going one click deeper down the measurement rabbit hole by agreeing on the definitions of another set of measures (some of which have sub-measures). These align roughly with the graphic above. Inputs are financial performance. Outputs are operational performance. Outcomes are beneficiary performance. Program Design sits at the intersection of financial and operational performance – it is the planned deployment of financial resources to operate programs, and is what actual financial and operational performance is then compared with (I decided to spare you yet another graphic depicting this).
(click on each to learn more)
Resources required to operate program/activity
The design of a program meant to drive outputs and outcomes
Measures of deliverables completed, reach, and/or engagement/participation with that deliverable
Measures of expected and eventual actual value created for beneficiaries
INPUTS are the financial quantification of the resources required to execute an organization’s program and include:
PROGRAM DESIGN is a detailed layout of what an organization intends to provide to create value
The specific planned actions taken in a program to achieve certain outputs and outcomes.
Program Design can be constrained by the availability of inputs, and it also shapes what inputs are required.
Program Design is what is planned and budgeted for. Outputs measure the actual execution of the program against this plan, and outcomes measure if it created the value that was intended.
Staffing costs (internal staff + contractors).
Program-related execution costs: “The venue, the menu, the seating” + travel and hotel.
Allocation of overall program-required investments (like content development or building tech platforms or measurement systems).
Allocation of overhead/administrative and any other enterprise costs.
Stipends/payments if applicable to program.
Number of beneficiaries expected to be reached and their level of participation (i.e., outputs).
Inputs and Program Design have an iterative relationship. Inputs can shape Program Design based on where Inputs are limited. Program Design can shape Inputs by identifying what resources are needed to execute on the program. Last, the execution of a program – and measuring its outputs – determines if a program is on budget, under budget, or over budget.
Program Design decisions for case-management-related programs such as tutoring, college and career advising, and mentoring
Dosage of a program
Duration – for how long is this program deployed – 1 year, 6 months, etc.?
Collectively, what is the expectation of how often beneficiaries engage with an organization’s programming?
Frequency – how often are beneficiaries engaged during this duration – once a week, once a month, etc.?
Intensity – amount of time per engagement – 10 minutes, 60 minutes, etc.?
Format of a program
Where is a program held – at school, work, home, or a mix?
When is a program held – specific time of day or anytime? Live, virtual, or hybrid? Real-time, asynchronous, or hybrid?
Pace of a program – fixed-pace, self-paced (with guardrails), and/or fully competency/mastery based?
Components of a program – classroom format (live or asynchronous), experiential (project-based or internship/apprenticeship), or hybrid?
Ratio of beneficiaries to program session – 1:1, small group, large group?
Caseload of a program – what is the total number of beneficiaries being supported by staff (usually one person, but could be a team)?
Costs/resources to enable program participation – food, transportation, parking, childcare, translation, tech, stipend, etc.?
Talent/technology of program delivery
Who are the personnel providing the program – what are their backgrounds and qualifications?
Sourcing/development of talent – how are they hired, trained, and managed?
Compensation – how much are they paid? What are the sources of funding and what are any spending restrictions?
Role of technology – when is the program provided by a person, a platform, or a combination?
Systems – what systems are provided to support program execution (and to provide continual data/feedback)?
OUTPUTS include measures of deliverables achieved, reach, and/or engagement/participation
DeliverableReachEngagement/ Participation
Measures of whether a deliverable was achieved.
Example measures include:
Was content such as curriculum or a training for a program created?
Was content published (if that is its purpose)?
Was an event or program held? How many times?
Measures of how many beneficiaries come into contact with programs and/or content.
Example measures include:
Registration to participate in a program.
Distribution list of content.
Measures of beneficiary participation in programming or engagement with content.
Example measures include:
Number of hours of participation in a program.
Completion of a program.
Interaction with content such as downloading or sharing.
OUTCOMES are the measures of value created
Satisfaction/PerceptionKnowledge/SkillsBeliefs/AttitudesActions Taken by StakeholdersChange in Performance or Status
Beneficiary assessment of value from participation (self-reported).
Learning that has happened (self-reported, observed, or pre-/post-test).
A change in a beneficiary’s belief or mindset about self or others; a change in relationships with others (self-reported or reported by others).
Actions taken by beneficiary that are meant to lead to a change in performance or status (self-reported or objectively measured).
Change in beneficiary achievement (improved GPA, increased earnings) and/or attainment (such as college enrollment, persistence, completion) (self-reported or objectively measured).
Satisfaction/Perception: Beneficiary assessment of value from participation (self-reported).
Knowledge/Skills: Learning that has happened (self-reported, observed, or pre-/post-test).
Beliefs/Attitudes: A change in a beneficiary’s belief or mindset about self or others; a change in relationships with others (self-reported or reported by others).
Actions Taken by Stakeholders: Actions taken by beneficiary that are meant to lead to a change in performance or status (self-reported or objectively measured).
Change in Performance or Status: Change in beneficiary achievement (improved GPA, increased earnings) and/or attainment (such as college enrollment, persistence, completion) (self-reported or objectively measured).
This does not include Systemic Impact outcomes such as policy change, funding, etc.
When considering Systemic Impact, there is a bonus fifth measure – Infrastructure of Community/Parent Power. For more information on this, please see the parent power page.
What about Impact?
The most common definitions of Impact.
Impact is sometimes used as a general umbrella term for all important measures.
Impact is sometimes used as the most long-term outcome that an organization ultimately aspires to achieve.
Impact is a word with many uses:
“The force of one thing striking another; the strong influence one thing has on another” (Merriam-Webster).
“Impact is the extent to which an intervention has generated, or is expected to generate, significant higher-level effects, whether positive or negative and whether intended or unintended” (OECD).
“Impact is the fundamental intended or unintended change occurring in organizations, communities, or systems as a result of program activities, within 7 to 10 years” (Kellogg).
Common themes: magnitude, importance, time horizon, and ability to attribute.
As with any term, the most important thing is for an organization to have and use a shared definition.
How does all this measurement complexity fit with an organization’s Intended Impact?
Intended Impact is the articulation of who an organization wants to serve, where they are, what it wants to accomplish for them, when (e.g., over what timeframe), and at what cost. Usually Intended Impact is the “top of the pyramid” of beneficiary outputs and outcomes an organization wants to achieve by the end of its strategic plan. But there are many earlier measures an organization will want to manage to because the performance against these measures determines an organization’s ability to achieve its Intended Impact.
For example, while a relatively simple program like ACT preparation (see below) is ultimately focused on test outcomes, there are many measures to manage to in order to achieve an improved ACT score. Even then, there are multiple ways to measure (and set targets) around ACT achievement.
In the second example below of college advising, ACT performance is just one of many outcomes in a more complicated program model. While this example’s ultimate outcome (i.e., its Intended Impact) is the % of 8th grade alumni who graduate from college, there are many measures of interim performance (outputs and outcomes) that determine how successful an organization and the students it serves will be in achieving that ultimate outcome.
Putting measurement into practice: ACT preparation
To see examples of measurement in action, please view this content on a computer.
Inputs
Program Design
Outputs
Outcomes (multiple examples)
$ Staffing
$ Content development and production
$ Session cost – food, venue
$ Overhead/Administrative
Dosage (64 total hours)
16 weeks of ACT prep
2 times per week
In 2-hour sessions
Format: In group classes of up to 25, after school at a high school, snacks provided
Deliverables
# New curriculum completed
# ACT tutoring sessions held
Reach
# who enroll
#/XX% who show up
Engagement/Participation
#/XX% of participants who complete 40+ hours of ACT prep
#/XX% of participants who complete 64 hours of ACT prep
Satisfaction: XX% who rate training 8+ out of 10
Knowledge/Skills: Improving by problem type
Beliefs/Attitudes: XX% who report training strengthened their confidence in themselves about taking the ACT
Actions: XX% of participants who take the ACT
Student Outcomes
XX% of participants who show a 4+ point improvement from pre-test
XX% of participants who score a 19+ on the ACT
XX% of participants who score a 23+ on the ACT
X total point improvement across all students in prep program
Putting measurement into practice: College access and success programming
= Inputs (without detail provided)
= Program Design (without detail provided)
= Outputs (deliverables, reach, or engagement)
= Outcomes (actions and student progress)
= “Leads To” cause and effect
Successfully applying to, enrolling in, and completing college has many steps, each with measures of performance (in this case going left to right) to understand if a program is on track or off track, where and why, and then how to address any challenges early to ensure the greatest achievement of the larger outcomes “downstream.” Please note – between matriculation and graduation are a whole additional set of potential program interventions that a nonprofit can also provide, each with their own measures.
Inputs
Program Design
Inputs
Program Design
Inputs
Program Design
Inputs
Program Design
Inputs
Program Design
Inputs
Program Design
Inputs
Program Design
Inputs
Program Design
There are many additional programs that can be provided by nonprofits or colleges directly to support students to remain in and successfully graduate from college.
# of students meeting with their adviser to make college decisions
% of seniors completing college essay editing program
Ultimate outcome% 6 year graduation rate from college
% of graduating HS class matriculating to college as of Sept% of graduating HS class matriculating to college within 12 months
% of seniors accepted to 3+ colleges% of seniors accepted to 1+ “high match” colleges
% of seniors submitting X college applications% of seniors submitting applications to X “high match” colleges
% of alumni who participate in summer Prep for College program to reduce “summer melt”
% of seniors with an XX+ ACT score
% of seniors spending XX hours in ACT prep
% of seniors with a list of X+ colleges to apply to including Y+ “high match” colleges
% of seniors with a clear life plan to guide decisions
% of seniors completing life plan programming
% of seniors completing college application training
% of seniors enrolling in a college% of seniors enrolling in a “high match” college
% of seniors with at least 50% of total cost covered at 1+ colleges% of seniors expected to accrue less than $5,500 in annual debt
% of seniors completing FAFSA by Feb 15
% of seniors applying for $K in scholarships
% of seniors and their families meeting 1:1 with a college adviser
Putting measurement into practice: College access and success programming
To see examples of measurement in action, please view this content on a computer.
Becoming more measurement-driven takes effort and can be a change-management journey for many organizations
Very few organizations can simply take another organization’s common language and adopt it. Rather, it usually needs to grow from existing “tribal speak” and a common journey of co-creation.
Very few organizations can simply adopt another organization’s measures and targets:
Measures can vary significantly based on the educational / nonprofit model of programming.
Measures may also vary based on population served.
Setting targets usually requires first having a baseline, especially for new measures.
Details really matter. For example: are all people/teams/sites calculating a common measure with a common formula and over a consistent timeframe?
Humans are humans.
People of good conscience can disagree.
Different people will care about different measures (based on values, responsibility).
People will tend to want to start very simple and then embrace complexity as they grow comfortable.
The more people are involved in the journey (in the right role), the more invested they are in the destination.
Many factors will constrain the speed at which an organization can adopt a new approach to being data-driven. Agreement on what data to collect and how to collect it can take time; selecting and implementing new data/reporting systems can take time; building new staff skills (including accountability systems) to collect data takes time.
C. Setting Targets
The “golden spiral” of the Fibonacci sequence of numbers is supposedly the reason the Mona Lisa is considered a “perfect” painting.
Target-setting is both an art and a science
A target (also sometimes called a goal) is NOT the same as a measure of input, program design, output, or outcome (or in the case of Systemic Impact strategies, Infrastructure).
A target is the specific performance an organization wants to achieve for any of these types of measures in a specific period of time.
Not all measures have targets, especially at first. An organization may track some important measures to inform its work but may choose not to set a target for them. Particularly in the case of a new effort (and new measures), organizations will sometimes track initial performance without setting a target to establish a baseline against which to set targets in the future.
Setting targets is about setting expectations and creating a social contract within the organization and externally with partners and funders.
Setting targets can create emotional safety. Targets tell stakeholders what success looks like for a specific period of time, and what they should be managing to. Targets dispel ambiguity.
A target should be what you need to achieve or believe you can achieve, not what you aspire to achieve. Organizations sometimes feel pressure to immediately set very high targets (occasionally called BHAGs or “Big Hairy Audacious Goals”), which, while aspirational, are not actually achievable in the timeframe of a strategic plan. Setting modest but achievable targets isn’t necessarily glamorous to funders and allies. Organizations may feel that they must promise to fly before running or even walking and commit to targets that aren’t achievable.
Explicitly laying out a BHAG as (a) aspirational and (b) achievable over a long period of time can be motivating, and it can be articulated as the organization’s Ultimate Vision. An organization would then be well served to lay out a more specific target or set of targets that are meaningful stepping-stones toward that BHAG and achievable in a shorter timeframe over the course of a strategic plan, and for which the organization can be held responsible.
Additionally, target-setting is based on the resources an organization believes will be available (financial, talent, systems, political capital, and partnerships) to fuel its Theory of Action. Constraints on resources become constraints on ambition and therefore targets of performance.
Setting the wrong expectations on targets can have consequences. Imagine two charter schools get funding from the same foundation. Charter School A sets its target at 50% proficiency in math because that is what it believes it can get in Year 1 of the grant. Charter School B sets its target at 80% proficiency in math in Year 1 because that is what it ultimately aspires to achieve. At the end of Year 1, Charter School A hits 52% proficiency and the funder is happy. Charter School B actually achieves 63% proficiency, but the funder considers pulling its funding because 63% is well below 80%.
An example of setting targets: student retention for a charter school network
In this example, a charter school network I once worked with wanted to improve its student retention (the number of students who stay with a school year-over-year) from a network average of 86% to 92% within three years. It had almost two dozen schools with significant variations in performance. One school, which we will call Fly Trap, had 97% year-over-year retention. In contrast, another school, which we will call Turnaround, had only 70% year-over-year retention.
We set the targets below for each school on the following timeline based on three rules we applied to the entire network.
An example of setting targets: Year-over-year retention for a charter school network
Network or school
Year 0 (Actual)
Year 1 (Target)
Year 2 (Target)
Year 3 (Target)
Network
86%
88%
90%
92%
School 1: Fly Trap
97%
92%
92%
92%
School 2: Turnaround
70%
80%
86%
92%
Rule 1: If Year 0 performance was >92%, the school’s target was 92%.
Rule 2: If Year 0 performance was at or above 80%, the Year 1 target was: (92% minus Year 0 performance) divided by 3. The school had three years of the same year-over-year improvement targets to get to 92% by end of Year 3.
Rule 3: If a school’s retention was below 80%, it had to get to at least 80% in Year 1 and then get to 92% by the end of Year 3.
When I sat down with Fly Trap, the school leader questioned why, at 97%, we were reducing her target to 92%. I explained that 97% is fantastic, but should we then set 98% or 99%? Is that really achievable? Her target was 92%; it didn’t mean her school couldn’t outperform the target (and thus contribute to the network’s overall weighted average retention). But we did not want to set expectations that penalized her team for being merely fantastic rather than perfect.
In contrast, for Turnaround, going from 70% to 92% in one year was not practical. But performance had to change. We set 80% in Year 1, which itself would be a substantial effort. Then the school had to continue to improve over the remaining two years to get to 92% by end of Year 3. This focused the entire staff of Turnaround on a specific target. They looked at other schools nationally and identified a series of strong practices to improve retention: (1) ensuring every student had a 1:1 relationship with a teacher; (2) ensuring every student participated in at least one extracurricular activity; (3) changing their disciplinary policies to focus on being restorative and minimizing out-of-school time; (4) building relationships with every parent or caregiver of a student; and (5) improving instruction (which may seem obvious but could easily be overlooked).
D. Dashboards
Organizations need dashboards to provide a clear visual picture of data that can then be the basis for conducting the “So What” of insight generation.
What makes a good dashboard or set of dashboards:
Provides data that is important to driving insights and then decisions that will advance impact.
Is shared at the right frequency to be actionable, balanced against when data becomes available.
Is shared in a visually accessible way for data to be easily understood.
Segments data as needed (for example, by program/business lines, beneficiary populations, geographies, partner types, etc.).
Provides the right level of detail to the right audience (while also enabling stakeholders to double-click into more detail if desired).
To see examples of dashboards, please view this content on a computer.
An example of a “to and through college” dashboard
Board
% of 8th grade alumni graduating from college within 6 years
% of remaining college-going 8th grade alumni persisting in college in year 7 and beyond
% of 8th grade alumni matriculating to college
Leadership
Toward College Graduation
% of 8th grade alumni in college accruing $5.5K or less in annual debt
% who matriculate to a college with a first-generation student graduation rate of 75% or more
% who matriculate to a college with a first-generation student graduation rate of 35% or less
Toward College Going
% of 8th grade alumni who graduate from high school
% of seniors accepted to at least 3 colleges on match list
% of seniors accepted to at least 3 colleges
Team-level(very partial list)
College Applications
% of seniors applying to X+ colleges
% of seniors applying to X+ colleges on match list
Financial Aid
% of seniors completing FAFSA by Feb 15
% of families attending a FAFSA education session
College Partnerships
% of alumni who matriculate to a partner college
% of college partnership slots filled by alumni
% of seniors accepted to at least 1 college partner
% of seniors applying to at least 1 college partner
% of seniors who have financial aid paperwork on file with college adviser
Included in leadership
Included in team-level
Drives
Drives
An example of a charter school dashboard on enrollment
Identical dashboards for the network and by school
NetworkSY 2024–25: School-Level DashboardUpdated: June 5, 2025
1. Enrollment
Prior year as a benchmarkThis year’s targetsMonthly review of actuals against targetsEnd-of-year performance against targets
SY 23–24
Target
Sept
Oct
Nov
Dec
Jan
Feb
Mar
April
May 31
Enrollment
Number
10,701
11,292
11,584
11,548
11,535
11,509
11,485
11,460
11,419
11,386
11,351
⇒ Note: Enrollment data is a snapshot as of the end of the month.
SY 23–24
Target
Sept
Oct
Nov
Dec
Jan
Feb
Mar
April
May 31
ADA
Percent
97.2%
97.6%
98.3%
98.1%
97.9%
97.7%
97.6%
97.6%
97.5%
97.5%
97.4%
Number
9,715
10,173
10,472
10,461
10,434
10,407
10,395
10,381
10,365
10,348
10,316
⇒ Note: ADA stands for Average Daily Attendance and represents the year-to-date number and percentage as of the end of the month.
SY 23–24
No Target
Sept
Oct
Nov
Dec
Jan
Feb
Mar
April
May 31
F/R Lunch
Percent
91.4%
91.6%
91.9%
90.6%
90.9%
91.1%
91.3%
91.6%
92.0%
92.2%
Number
9,779
10,616
10,612
10,448
10,463
10,781
10,468
10,462
10,477
10,465
LEP
Percent
29.3%
33.6%
33.5%
33.5%
33.6%
32.7%
33.7%
34.1%
34.1%
34.0%
Number
3,132
3,895
3,869
3,866
3,865
3,871
3,863
3,893
3,882
3,856
SPED
Percent
5.2%
4.5%
4.8%
4.8%
4.9%
4.8%
5.0%
5.1%
5.3%
5.4%
Number
560
526
555
555
563
569
571
582
603
617
⇒ Note: F/R (Free and reduced lunch), LEP (Limited English Proficiency), and SPED (Special Education) data is a snapshot as of the end of the month.
Some outcomes deliberately do not have a target
Different colors were used to clearly differentiate between historic performance, target performance, and final-year actual performance. While some measures had targets, others did not. For example, this charter network cared about how many students it served who were eligible for Free and Reduced-Price Lunch, classified as Limited English Proficient, or in need of special education services. All three were core to the charter’s mission, but there were no specific targets it was managing to. This dashboard existed for the network but could immediately be converted to show each school. Before long, school leaders knew their manager (and the superintendent) would visit their school having looked at data, and they were expected to have reviewed it, analyzed it, and come up with options or decisions on how to respond.
This was one of eight dashboards the charter network used:
Enrollment and attendance (above).
Retention of students year-over-year.
Formative assessments: quarterly pass rates.
State assessments, norm-referenced tests, and SAT/ACT.
High school graduation, college matriculation, persistence, and completion.
Financial performance.
Staff performance, satisfaction, retention, and open roles.
Fundraising.
E. Contribution and Attribution
Measuring is one thing. Claiming credit for improvement in what you are measuring is something else.
Organizations can more easily demonstrate contribution (I made a difference) or attribution (I made THE difference) when they have more control over their programming, and when their programming controls more variables.
This is why it is generally easier to demonstrate contribution/attribution for Direct Impact models than for Widespread Impact models, because an organization running a program directly has more control (sometimes significantly more) than it does over programming run by partners.
This is also why it is easier to demonstrate contribution/attribution for comprehensive models like a charter school, which can control most or all variables in a school (see the graphic in the Theory of Action section), than for a program like professional development (PD) or curriculum, which is just one of many variables in running a school. This doesn’t mean it is impossible to evaluate PD or curriculum for contribution/attribution; it’s just more difficult.
Systemic Impact can be particularly challenging for some organizations seeking to claim contribution/attribution.
In policy change, as the saying goes, “victory has many parents, and failure is an orphan.” Many different organizations may be working to shift mindsets, relationships, and power in order to change policies, practices, and resource flows, which makes it hard for any single organization to claim credit.
Even within a single organization’s Systemic Impact campaign, many different actions (e.g., canvassing, online communications, testifying, lobbying, boycotts) can be employed, and it can be challenging to identify which particular action was most effective, especially since these actions are usually meant to reinforce one another.
A lot can happen between winning an electoral or issue campaign and seeing the resulting program implemented effectively and delivering its intended value. For more on the trials and tribulations of policy implementation, please click here.
When deciding how to demonstrate contribution/attribution for a measure of value, organizations have five options.
Common Sense. Nobody is going to defend their doctoral dissertation based on this, but I do think it is a valid approach to consider. For example, just because a program is funded doesn’t mean it will be successful. But if a program isn’t funded in the first place, it won’t exist, so a successful effort to unlock funding should get some credit for the program’s eventual success, if it comes.
Perception. Involved stakeholders (system leaders, school leaders, teachers, students, parents) believe that something an organization provided resulted in, or heavily contributed to, the creation of a measure of value. Sometimes perception is reality. If student outcomes improve, and those closest to those students (from teachers to the students themselves) believe it is because of a program, that should carry some weight. Perception does have its limits: people may perceive something that is not true (Learning Heroes does great work demonstrating the gap between parents’ perceptions of student success and reality). However, in that case, hard data showing a lack of performance is available to compare against perception (and dispel it).
Evaluations by other organizations. Have other organizations with similar program models conducted an evaluation that demonstrates value? If so, an organization can use that evaluation to make the case that faithful implementation of its model will achieve similar outcomes.
One-time (or episodic) evaluation of an organization’s own work to demonstrate value. An organization can use this evaluation to make the case that future faithful implementation of its own specific model will continue to achieve the same outcomes. This is stronger than relying on an evaluation from another organization.
Ongoing tracking of outcomes to demonstrate, net of other variables, that an organization is continually creating value. This is the most powerful option but, not surprisingly, can also be the costliest.
Sign up to get the latest tools, insights, and research
Email me with questions, comments, feedback, or to schedule a chat